Design a Report in Power BI Desktop
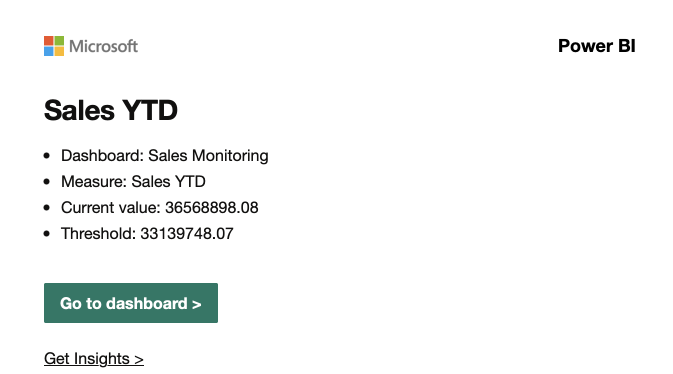
Create an alert
-
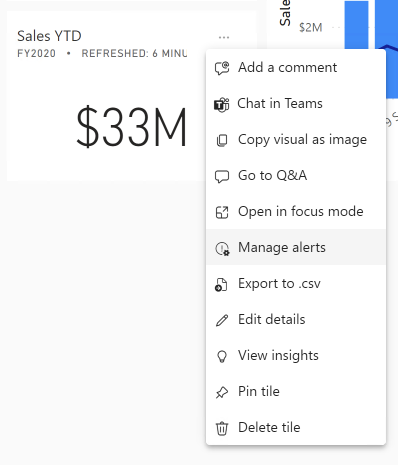
Hover the cursor over the Sales YTD tile, and then at the top-right of the tile, select the ellipsis, and then select Manage Alerts.
-
In the Manage Alerts pane (located at the right), click the Add alert rule, enter 35139748.07 undert Threshold, and then select Save and Close.
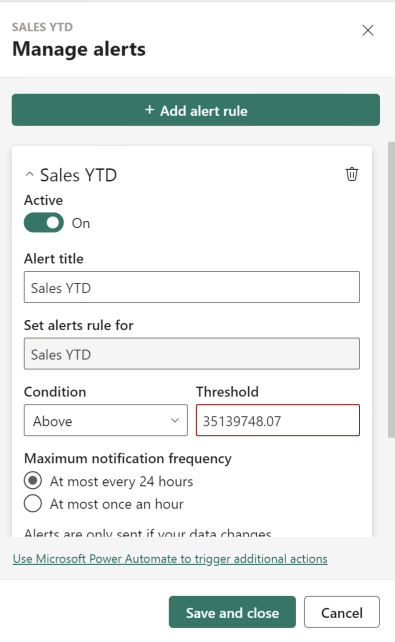
If you want to use Power Automate to trigger additional actions, first you need to save the alert, and then click manage alerts on the tile
Refresh the Dataset
In this exercise, we will simulate data refresh. You’ll update the dataset to point to another database, which includes sales order data for June 2020. You’ll then open your Power BI Desktop file, change the datasource, and then upload the file to your workspace.
Update the lab database
-
Open your file in PowerBI desktop
-
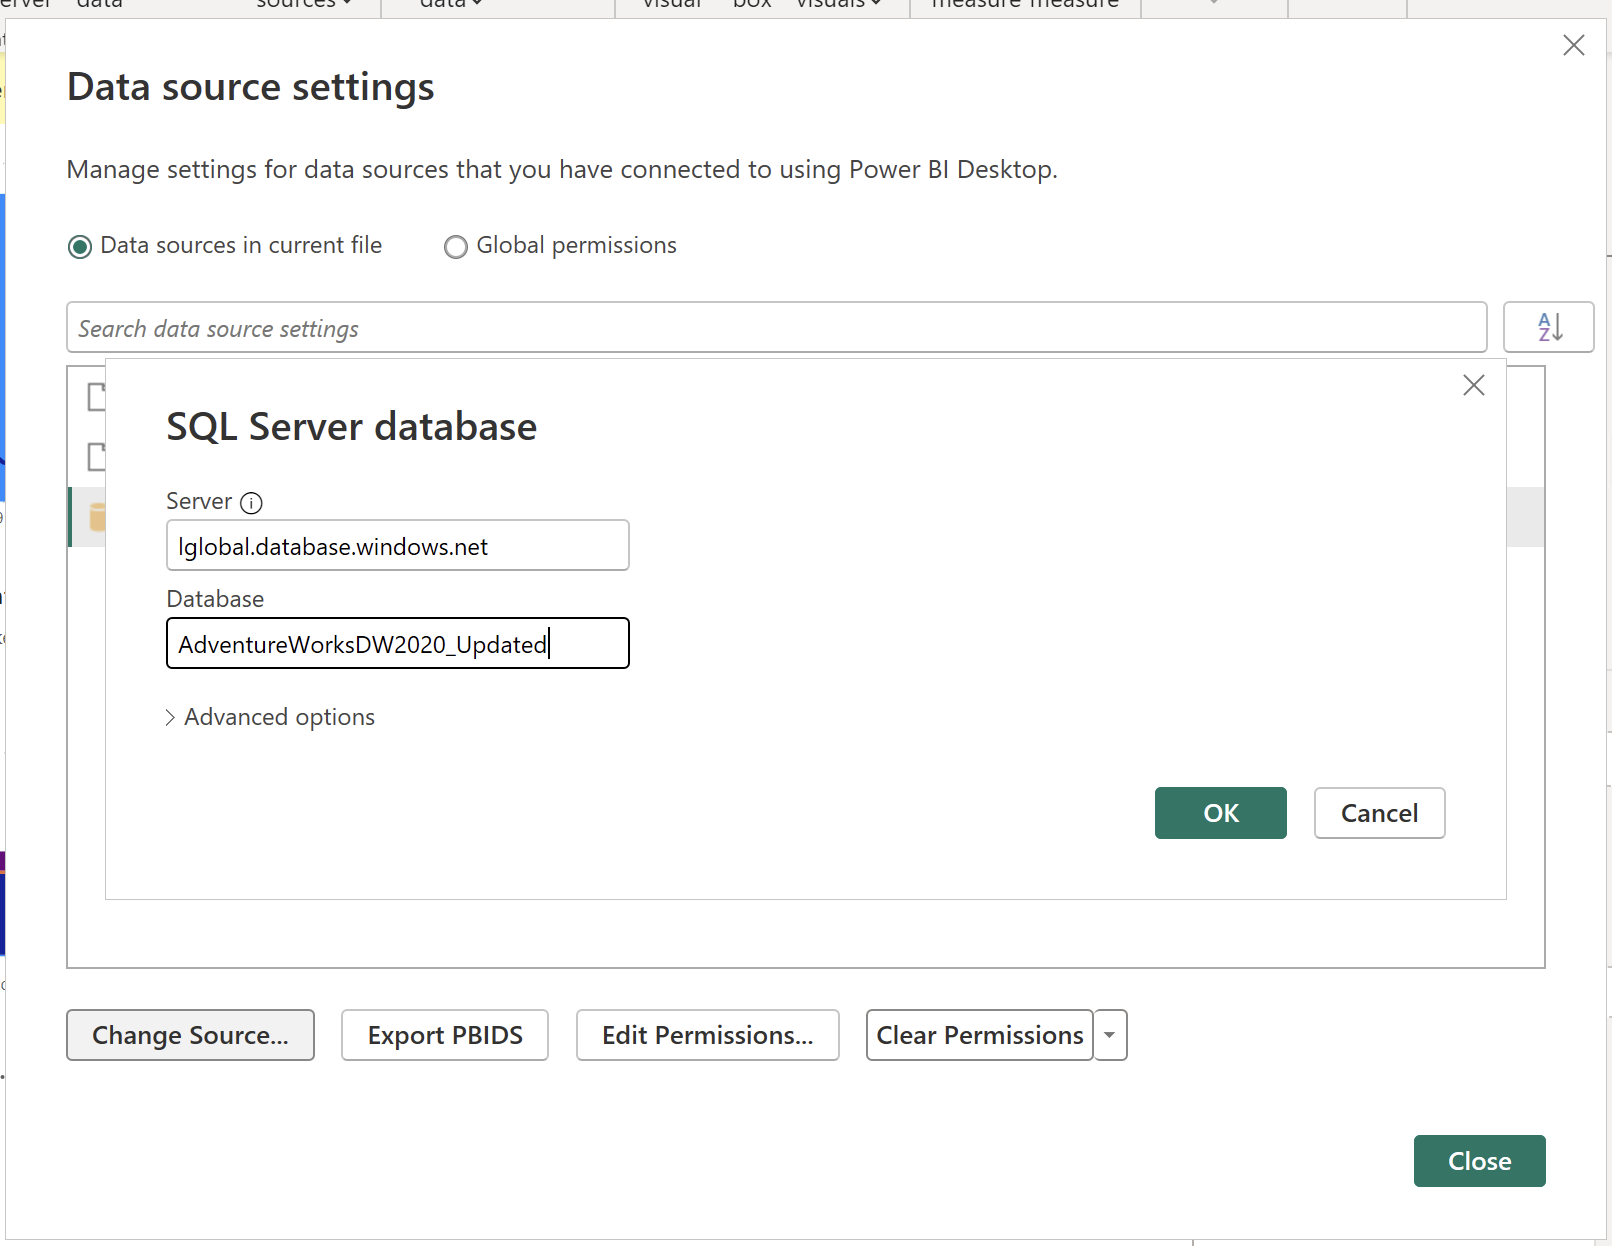
In top menu, under Transform Data select Data source setting
-
Select lglobal.database.windows.net… and Click Change Source. Type AdventureWorksDW2020_Updated in the database field. click OK and Close.
-
Click “Apply Changes”.
-
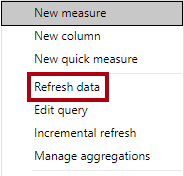
In Power BI Desktop file, in the Data pane, right-click the Sales table, and then select Refresh Data.
-
When the refresh completes, save the Power BI Desktop file.
-
To publish the file to your workspace, on the Home ribbon tab, from inside the Share group, select Publish and then select Select to publish.

-
When prompted to replace the dataset, select Replace.
-
Close Power BI Desktop.
The dataset in the Power BI service now has June 2020 sales data.
Review the dashboard
In this task, you’ll review the dashboard to notice updated sales.
-
In the Microsoft Edge browser window, open Power BI service, and then review the Sales Monitoring dashboard in My Workspace.
-
In the Sales, Profit Margin tile, in line with the subtitle, notice that the data was Refreshed: NOW.
-
Notice also that there’s now a column for 2020 Jun.
If you don’t see the June 2020 data, you might need to press F5 to reload the web browser.
-
You should have received an email alert notification.
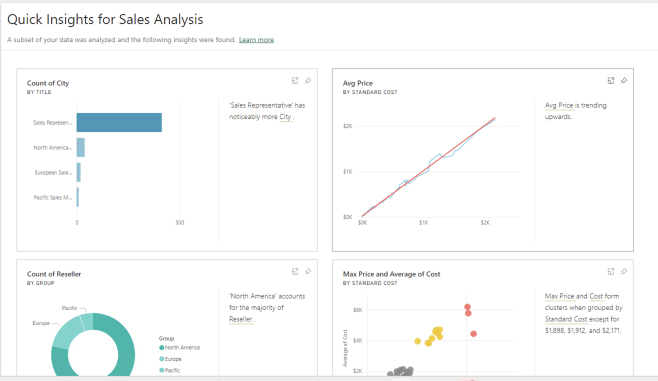
Use automated insights
There are no step-by-step guidance, try to find solution on your own
In this task, you’ll use the feature to automatically create visualisations for dashboards
-
In PowerBI Service, in your workspace, find a dataset for the report
-
Use View Insights report
-
Create a new Dashboard with all cost related metrics ang graphs
Share the dataset
There are no step-by-step guidance, try to find solution on your own
In this task, you’ll share only the dataset with a co-worker
-
In PowerBI Service, in your workspace, find a dataset for the report
-
Through Manage permission, add an user who can build content with this dataset