PowerBI Service - Dashboards, Alerts, Sharing, Security
Lab story
In this lab, you’ll create the Sales Monitoring dashboard in the Power BI service using an existing report.
In this lab you learn how to:
- Pin visuals to a dashboard
- Use Q&A to create dashboard tiles
This lab should take approximately 45 minutes.
Get started – Sign in
In this task, you’ll set up the environment for the lab by signing in to Power BI.
Note: If you’ve already signed in to Power BI, skip to the next task.
-
To open Microsoft Edge, on the taskbar, select the Microsoft Edge program shortcut.

-
In the Microsoft Edge browser window, navigate to https://app.powerbi.com.
Tip: You can also use the Power BI Service favorite on the Microsoft Edge favorites bar.
-
Complete the sign-in process with your organizational credentials (or those provided to you). If prompted by Microsoft Edge to stay signed in, select Yes.
-
In the Microsoft Edge browser window, in the Power BI service, in the Navigation pane, expand My Workspace. Leave the Microsoft Edge browser window open.
Get started – Open report
In this task, you’ll set up the environment for the lab by opening the starter report.
Important: If you’re continuing on from the previous lab (and you completed that lab successfully), don’t complete this task; instead, continue from the next task.
-
Open Power BI Desktop.
By default, the Getting Started dialog box opens in front of Power BI Desktop. Sign-in, and then close the pop-up.

-
To open the starter Power BI Desktop file, select the File > Open Report > Browse Reports.
-
In the Open window, navigate to the C:\PBI_Training\StarterFiles\Lab_07 folder, and open the Sales Analysis file.
-
Close any informational windows that may open.
-
Notice the yellow warning message beneath the ribbon. This message alerts you to the fact that the queries haven’t been applied to load as model tables. You’ll apply the queries later in the lab.
To dismiss the warning message, at the right of the yellow warning message, select X.
-
To create a copy of the file, go to File > Save As and save to C:\PBI_Training\MySolution folder.
-
If prompted to apply changes, select Apply Later.
Get started – Publish the report
In this task, you’ll set up the environment for the lab by creating a dataset. If you’ve already published the dataset, please move to the next task.
-
In the Microsoft Edge browser window, in the Power BI service, navigate to My Workspace.
-
Select Upload > Browse.
-
Navigate to C:\PBI_Training\StarterFiles\Lab_07 folder.
-
Select the Sales Analysis.pbix file, and then select Open.
If prompted to replace the dataset, select Replace it.
Create a dashboard
In this task, you’ll create the Sales Monitoring dashboard. You’ll pin a visual from the report, and add a tile based on an image data URI, and use Q&A to create a tile.
-
In the Power BI service, open the Sales Analysis report.
-
In the Overview page, set the Year slicer to FY2020.
-
Set the Region slicer to Select All.
Pinned visuals are set with the filter context at time of pin. If the underlying visual changes, you’ll need to update the dashboard tile as well. For time-based filters, it’s a better idea to use a relative date slicer (or, Q&A using a relative time-based question).
-
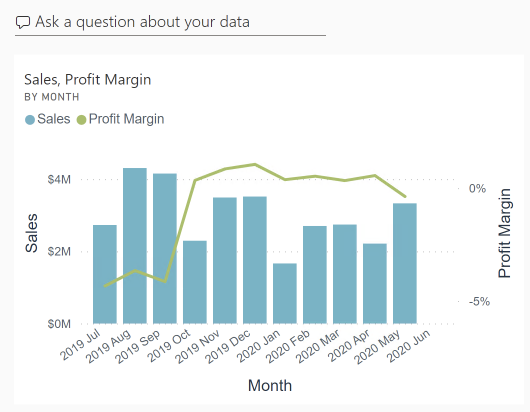
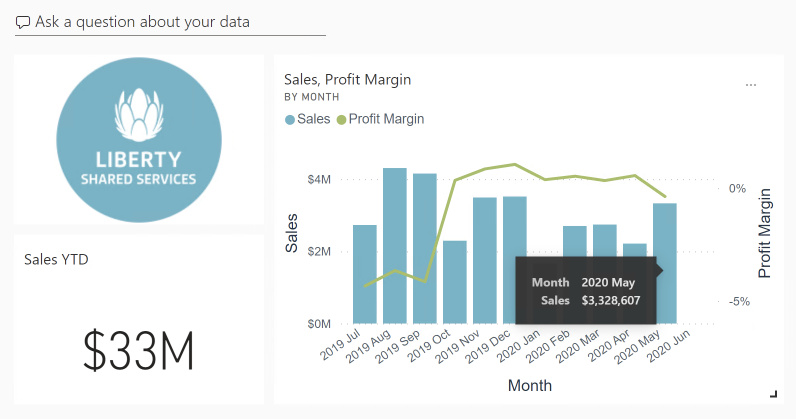
To create a dashboard and pin a visual, hover the cursor over the Sales and Profit Margin by Month (column/line) visual, and select the pushpin.
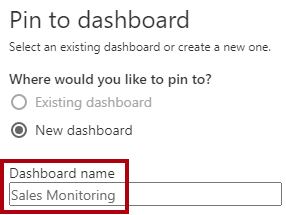
-
In the Pin to Dashboard window, in the Dashboard Name box, enter Sales Monitoring, then select Pin.
-
Open My Workspace and open the Sales Monitoring dashboard.
-
Notice that the dashboard has a single tile.
-
To add a tile based on a question, at the top-left of the dashboard, select Ask a Question About Your Data.
You can use the Q&A feature to ask a question, and Power BI will respond will a visual.
-
Select any one of the suggested questions beneath the Q&A box, in blue boxes, and review the response.
-
Remove all text from the Q&A box, and enter the following: Sales YTD
-
Notice the response of (Blank).
You may recall you added the Sales YTD measure in the Create Advanced DAX Calculations in Power BI Desktop lab. This measure is a Time Intelligence expression and it so requires a filter on the Date table to produce a result.

-
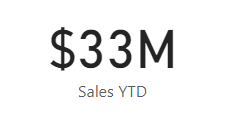
Extend the question with: in year FY2020.
-
Notice the response is now $33M.
-
To pin the response to the dashboard, at the top-right corner, select Pin Visual.
-
When prompted to pin the tile to the dashboard, select Pin.
-
To return to the dashboard, at the top-left corner, select Exit Q&A.
-
To add the company logo, on the menu bar, select Edit, and then select Add a Tile.
Using this technique to add a dashboard tile lets you enhance your dashboard with media, including web content, images, richly formatted text boxes, and video (using YouTube or Vimeo links).
-
In the Add a Tile pane (located at the right), select the Image tile, then Next.
-
In the Add Image Tile pane, in the URL box, enter the complete URL https://nephossi.github.io/LGPowerBI/Instructions/Image/LGLogo.png, and then Apply.
You can embed an image by using its URL, or you can use a data URL, which embeds content inline.
-
To resize the logo tile, drag the bottom-right corner, and resize the tile to become one unit wide, and two units high.
Tile sizes are limited to a rectangular shape.
-
Organize the tiles so that the logo appears at the top-left, with the Sales YTD tile beneath it, and the Sales, Profit Margin tile at the right.
Edit tile details
In this task, you’ll edit the details of two tiles.
-
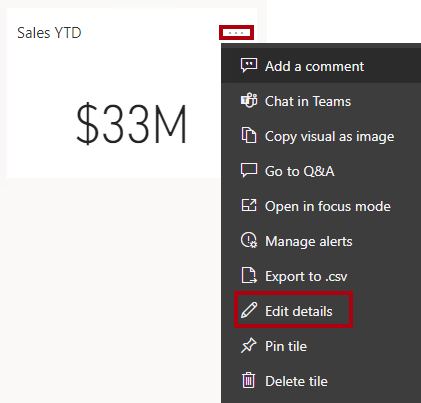
Hover the cursor over the Sales YTD tile, and then at the top-right of the tile, select the ellipsis, and then select Edit Details.
-
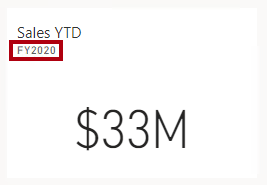
In the Tile Details pane (located at the right), in the Subtitle box, enter FY2020, and then select Apply.
-
Notice that the Sales YTD tile displays a subtitle.
-
Edit the tile details for the Sales, Profit Margin tile.
-
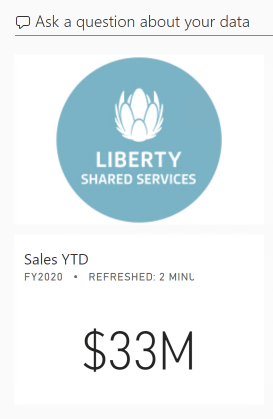
In the Tile Details pane, in the Functionality section, check Display Last Refresh Time, and then Apply.
-
Notice that the tile describes the last refresh time (which done when loading the data model in Power BI Desktop).
You’ll refresh the dataset in the next exercise. Depending on your data and report, you can do an adhoc data refresh anytime or set a schedule. However, scheduled refreshes require gateways that we aren’t able to configure for this lab. So from Power BI Desktop, you’ll perform a manual data refresh, and then upload the file to your workspace.
Finish up
In this task, you’ll complete the lab.
- Save the report and close your browser.